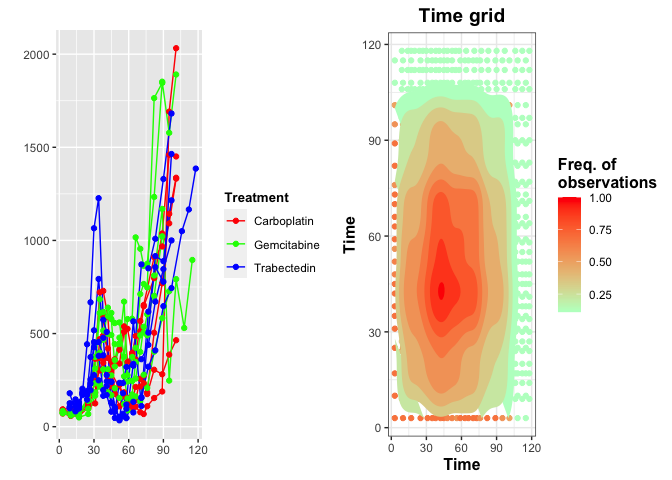
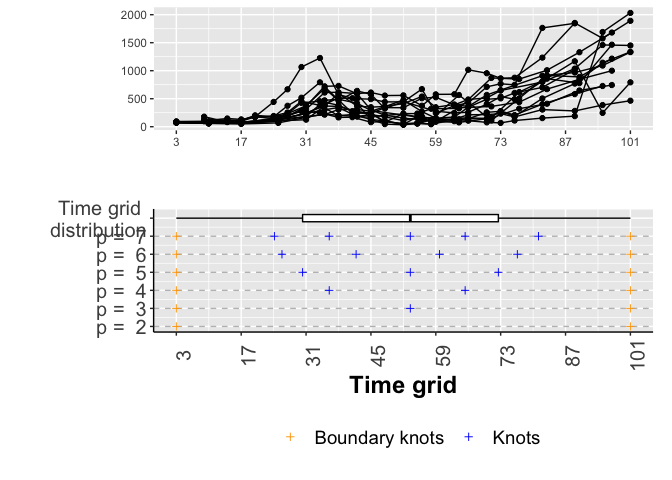
In the first set of PDX lines (PDX line #475), 21 curves are collected from five serial passages (1 on P1, 2 on P2, 2 on P3, 5 on P4 and 11 on P5). Regrettably, the patient relapsed after six months, at post-chemotherapy surgery, another sample from the same patient was propagated in 17 PDX line obtained from five serial passages. Those were treated with three different drugs carboplatin, gemcitabine and trabectedin.
475 without treatment
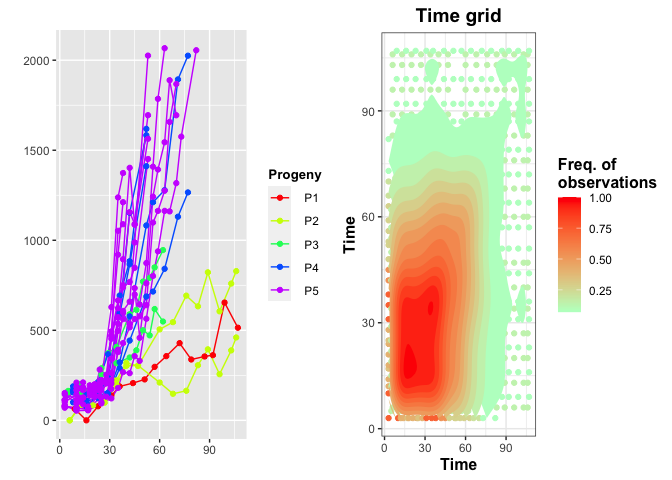
From the plots it is straightforward that we should truncate at time 70.
#> ##############################################################
#> ######## Summary of the trunc. data ############
#>
#>  Number of curves: 21 ;
#>  Min curve length:  7 ; Max curve length:  16 ;
#>
#>  Number of truncated curves: 6 ;
#>  Min points deleted:  2 ; Max points deleted:  6 ;
#> ##############################################################
#> NULL
p selection

Cross-validated loglikelihood functions.

Knots ditribution.
We set p= 3.
G selection
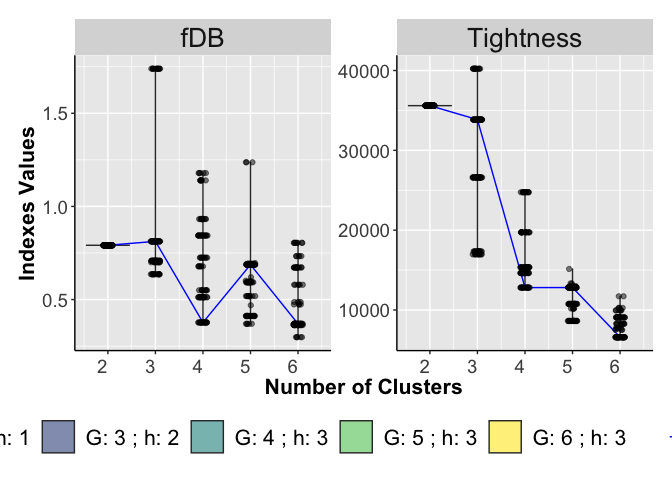
Violin Plots of the *T* calculated on each run and for different number of clusters *G* (right panel). Violin Plots of the fDB calculated on each run and for different number of clusters *G* (left panel).
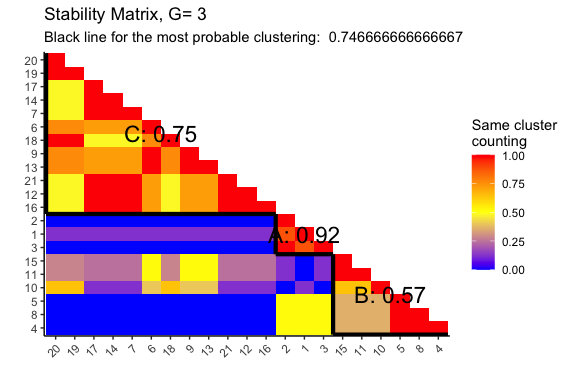
Consensus Matrices for G = 3.
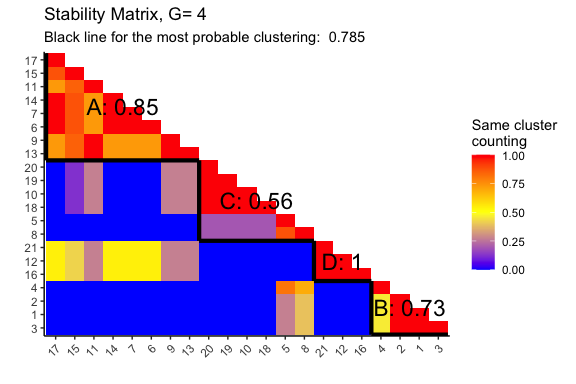
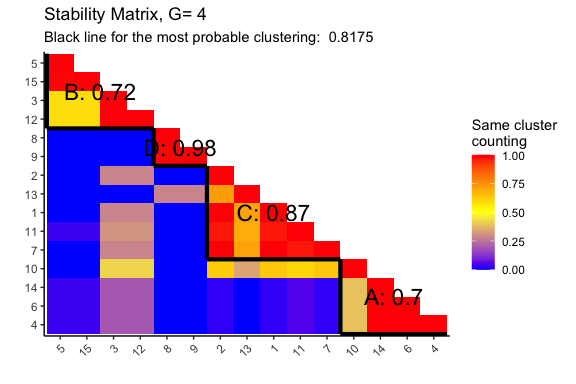
Consensus Matrices for G = 4.
#>
#> ######## S indexes ############
#>
#>
#> |          |        S|      S_1|       S_2|
#> |:---------|--------:|--------:|---------:|
#> |Cluster B | 606.2910| 26.12682| 0.8460414|
#> |Cluster D | 216.1548| 15.82292| 0.1696058|
#> |Cluster C | 885.1669| 47.96062| 1.9233843|
#> |Cluster A | 770.7952| 33.38136| 1.0607070|
#>
#> ##############################################################
#> ##############################################################
#>
#>######## M indexes ############
#>
#>
#> |          | Cluster B| Cluster D| Cluster C| Cluster A|
#> |:---------|---------:|---------:|---------:|---------:|
#> |Cluster B |     0.000|  21764.75|  3023.052|  7693.948|
#> |Cluster D | 21764.749|      0.00| 18440.803| 13338.149|
#> |Cluster C |  3023.052|  18440.80|     0.000|  3704.963|
#> |Cluster A |  7693.948|  13338.15|  3704.963|     0.000|
#>
#> ##############################################################
#> ######## R indexes ############
#>
#>
#> |          |         R|       R_1|       R_2|
#> |:---------|---------:|---------:|---------:|
#> |Cluster B | 0.4933616| 0.4508310| 0.4741507|
#> |Cluster D | 0.0739945| 0.0796267| 0.0831792|
#> |Cluster C | 0.4933616| 0.4508310| 0.4741507|
#> |Cluster A | 0.4469578| 0.4224527| 0.4589958|
#>
#> ##############################################################
#> ######## fDB indexes ############
#>
#>
#> |       fDB|     fDB_1|     fDB_2|
#> |---------:|---------:|---------:|
#> | 0.3769189| 0.3509354| 0.3726191|
#>
#> ##############################################################
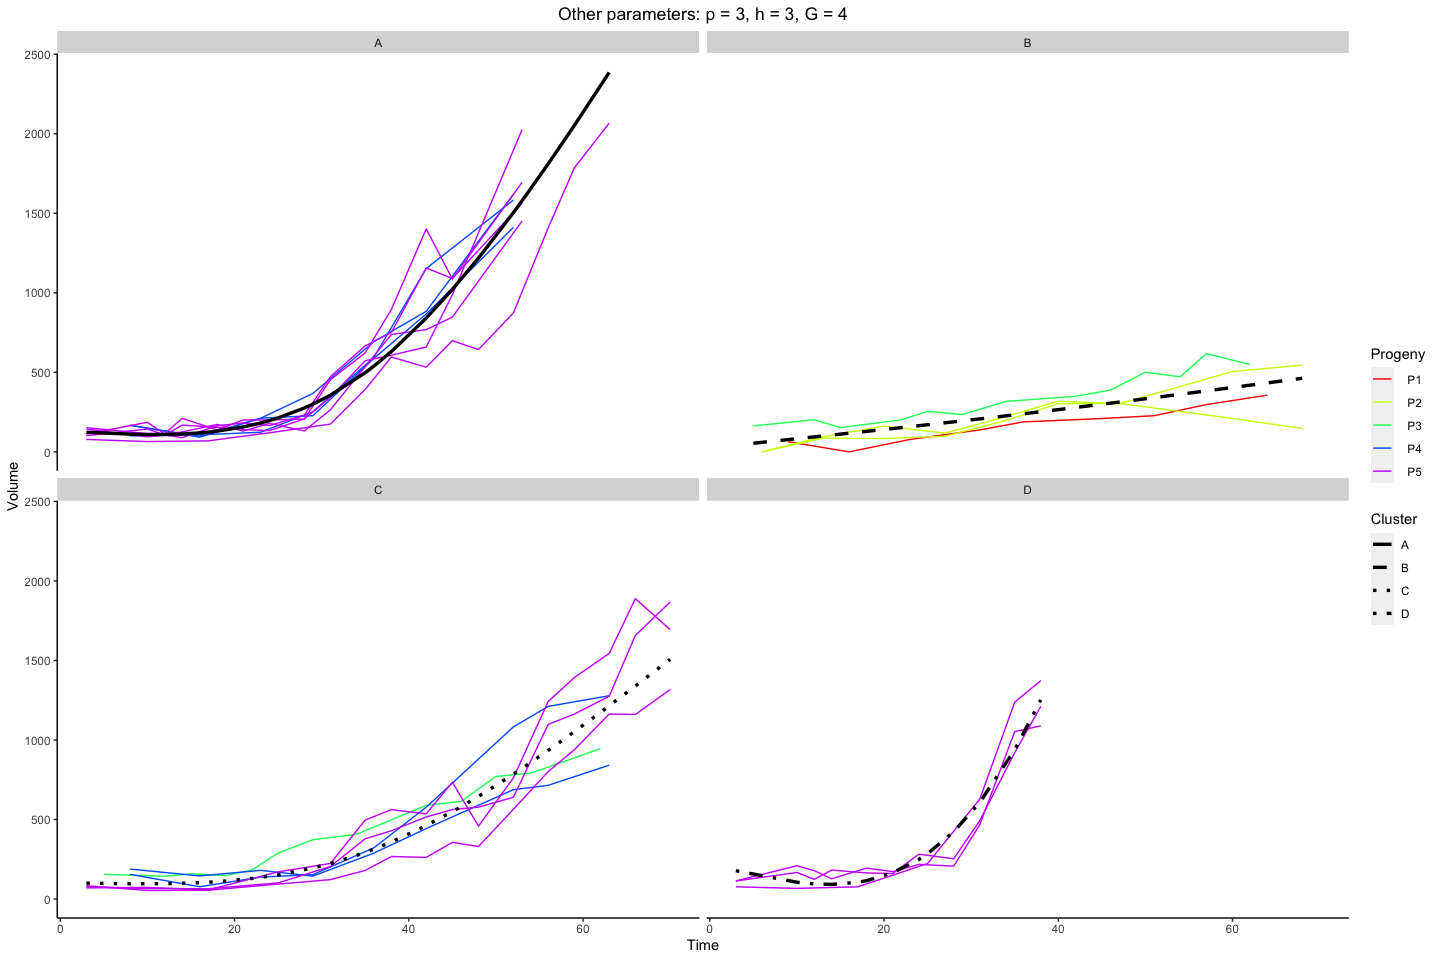
Sampled curves grouped by cluster membership.
Maximum Discrimination Function
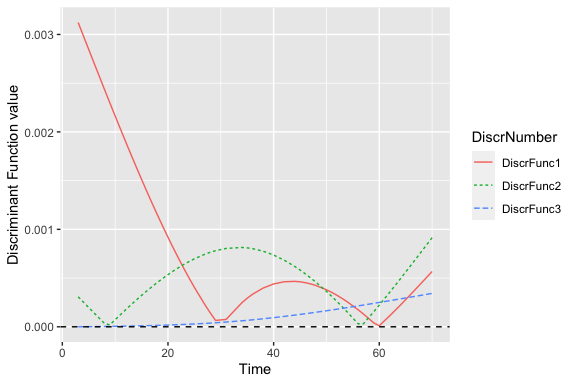
Discriminant curve.
475 with treatment
From the plots it is straightforward that we should truncate at time 102.
#> ##############################################################
#> ######## Summary of the trunc. data ############
#>
#>  Number of curves: 15 ;
#>  Min curve length:  20 ; Max curve length:  22 ;
#>
#>  Number of truncated curves: 2 ;
#>  Min points deleted:  2 ; Max points deleted:  3 ;
#> ##############################################################
#> NULL
p selection
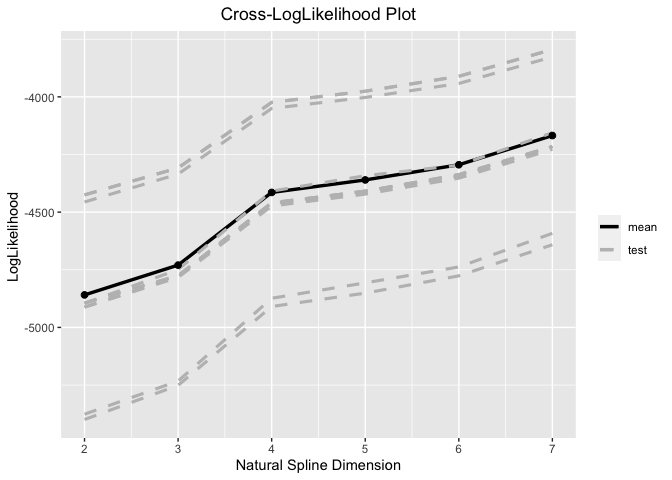
Cross-validated loglikelihood functions.
Knots ditribution.
We set p = 4.
G selection

Violin Plots of the *T* calculated on each run and for different number of clusters *G* (right panel). Violin Plots of the fDB calculated on each run and for different number of clusters *G* (left panel).
Consensus Matrices for G = 3 and 4.
Consensus Matrices for G = 3 and 4.
Consensus Matrices for G = 3 and 4.
#>
#> ######## S indexes ############
#>
#>
#> |          |        S|      S_1|      S_2|
#> |:---------|--------:|--------:|--------:|
#> |Cluster A | 807.1756| 37.14446| 1.469200|
#> |Cluster C | 659.1270| 34.31360| 1.666216|
#> |Cluster D | 771.5633| 64.40062| 3.290875|
#> |Cluster B | 645.8487| 56.61952| 3.422565|
#>
#> ##############################################################
#> ##############################################################
#>     #>######## M indexes ############
#>
#>
#> |          | Cluster A| Cluster C| Cluster D| Cluster B|
#> |:---------|---------:|---------:|---------:|---------:|
#> |Cluster A |     0.000|  2961.382|  6195.416|  2222.212|
#> |Cluster C |  2961.382|     0.000|  3256.674|  2045.696|
#> |Cluster D |  6195.416|  3256.674|     0.000|  4734.993|
#> |Cluster B |  2222.212|  2045.696|  4734.993|     0.000|
#>
#> ##############################################################
#> ######## R indexes ############
#>
#>
#> |          |         R|       R_1|      R_2|
#> |:---------|---------:|---------:|--------:|
#> |Cluster A | 0.6538639| 0.7606785| 1.674635|
#> |Cluster C | 0.6379128| 0.9113294| 1.674635|
#> |Cluster D | 0.4393102| 0.9508592| 1.559814|
#> |Cluster B | 0.6538639| 0.9508592| 1.060716|
#>
#> ##############################################################
#> ######## fDB indexes ############
#>
#>
#> |       fDB|     fDB_1|   fDB_2|
#> |---------:|---------:|-------:|
#> | 0.5962377| 0.8934316| 1.49245|
#>
#> ##############################################################

Sampled curves grouped by cluster membership.
#>
#> ######## S indexes ############
#>
#>
#> |          |        S|       S_1|       S_2|
#> |:---------|--------:|---------:|---------:|
#> |Cluster D | 473.0456| 32.844295| 1.3472378|
#> |Cluster C | 156.0990|  7.456115| 0.2932808|
#> |Cluster B | 699.1283| 51.601944| 2.0659544|
#> |Cluster E | 796.7732| 60.813671| 2.7074830|
#> |Cluster A | 471.7255| 33.206017| 1.2844733|
#>
#> ##############################################################
#> ##############################################################
#>     #>######## M indexes ############
#>
#>
#> |          | Cluster D| Cluster C| Cluster B| Cluster E| Cluster A|
#> |:---------|---------:|---------:|---------:|---------:|---------:|
#> |Cluster D |     0.000|  2753.237|  1808.012|  3155.357|  3500.547|
#> |Cluster C |  2753.237|     0.000|  2038.902|  4771.800|  3401.358|
#> |Cluster B |  1808.012|  2038.902|     0.000|  4844.581|  1887.393|
#> |Cluster E |  3155.357|  4771.800|  4844.581|     0.000|  6639.858|
#> |Cluster A |  3500.547|  3401.358|  1887.393|  6639.858|     0.000|
#>
#> ##############################################################
#> ######## R indexes ############
#>
#>
#> |          |         R|       R_1|       R_2|
#> |:---------|---------:|---------:|---------:|
#> |Cluster D | 0.6483220| 1.4391375| 1.7804813|
#> |Cluster C | 0.4194548| 0.3675198| 0.2511361|
#> |Cluster B | 0.6483220| 1.4391375| 1.9821644|
#> |Cluster E | 0.4024327| 0.8537877| 1.9821644|
#> |Cluster A | 0.6203549| 1.1030245| 1.7804813|
#>
#> ##############################################################
#> ######## fDB indexes ############
#>
#>
#> |       fDB|    fDB_1|    fDB_2|
#> |---------:|--------:|--------:|
#> | 0.5477773| 1.040521| 1.555286|
#>
#> ##############################################################

Sampled curves grouped by cluster membership.
#>
#> ######## S indexes ############
#>
#>
#> |          |          S|        S_1|       S_2|
#> |:---------|----------:|----------:|---------:|
#> |Cluster F | 686.758979| 51.4845541| 2.2595634|
#> |Cluster D | 106.435596|  3.8390694| 0.1339198|
#> |Cluster B |   3.765197|  0.2266327| 0.0075966|
#> |Cluster E | 429.371529| 29.3742450| 1.1575786|
#> |Cluster C | 194.355460| 12.2310961| 0.3971698|
#> |Cluster A | 443.214705| 30.0225986| 1.1418504|
#>
#> ##############################################################
#> ##############################################################
#>     #>######## M indexes ############
#>
#>
#> |          | Cluster F| Cluster D| Cluster B| Cluster E| Cluster C| Cluster A|
#> |:---------|---------:|---------:|---------:|---------:|---------:|---------:|
#> |Cluster F |     0.000|  4758.549|  5381.300|  3137.618|  4732.006|  6610.178|
#> |Cluster D |  4758.549|     0.000|  3119.349|  2754.746|  1787.411|  3412.938|
#> |Cluster B |  5381.300|  3119.349|     0.000|  2537.817|  1973.223|  2133.111|
#> |Cluster E |  3137.618|  2754.746|  2537.817|     0.000|  1793.214|  3486.422|
#> |Cluster C |  4732.006|  1787.411|  1973.223|  1793.214|     0.000|  2048.008|
#> |Cluster A |  6610.178|  3412.938|  2133.111|  3486.422|  2048.008|     0.000|
#>
#> ##############################################################
#> ######## R indexes ############
#>
#>
#> |          |         R|       R_1|       R_2|
#> |:---------|---------:|---------:|---------:|
#> |Cluster F | 0.3557255| 0.7562400| 1.3370660|
#> |Cluster D | 0.1945033| 0.2947731| 0.1974405|
#> |Cluster B | 0.2095437| 0.4362380| 0.5253644|
#> |Cluster E | 0.3557255| 0.7562400| 1.5230721|
#> |Cluster C | 0.3478264| 0.6319996| 1.3370660|
#> |Cluster A | 0.3113124| 0.6269030| 1.5230721|
#>
#> ##############################################################
#> ######## fDB indexes ############
#>
#>
#> |       fDB|     fDB_1|    fDB_2|
#> |---------:|---------:|--------:|
#> | 0.2957728| 0.5837323| 1.073847|
#>
#> ##############################################################
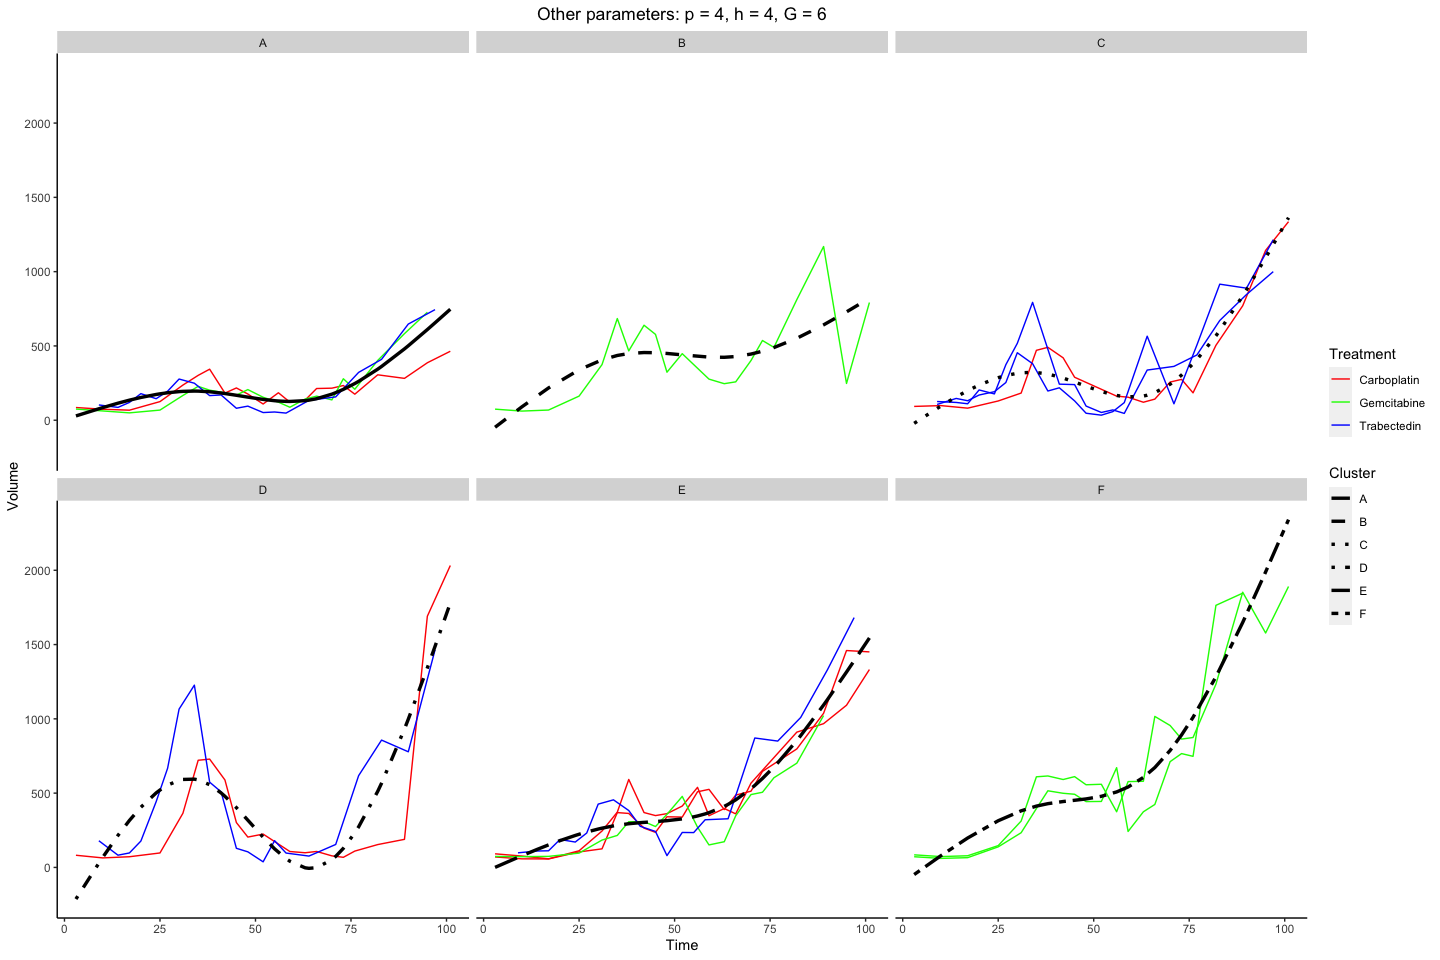
Sampled curves grouped by cluster membership.
Maximum Discrimination Function

Discriminant curve.